

Measure visitor traffic and optimize bank branches with actionable insights
- 21.10.2026
- Reading Time: {{readingTime}} min
Contents
Identify, understand, and optimize branch usage with KeBob Analyst
A well-functioning self-service area enables customers to carry out their banking easily. Improving this area requires an understanding of how it is actually used. Transaction figures from individual devices provide valuable information, but they do not answer every question: one person may use both an ATM and a statement printer during a single visit. Two transactions therefore do not necessarily mean two visits.
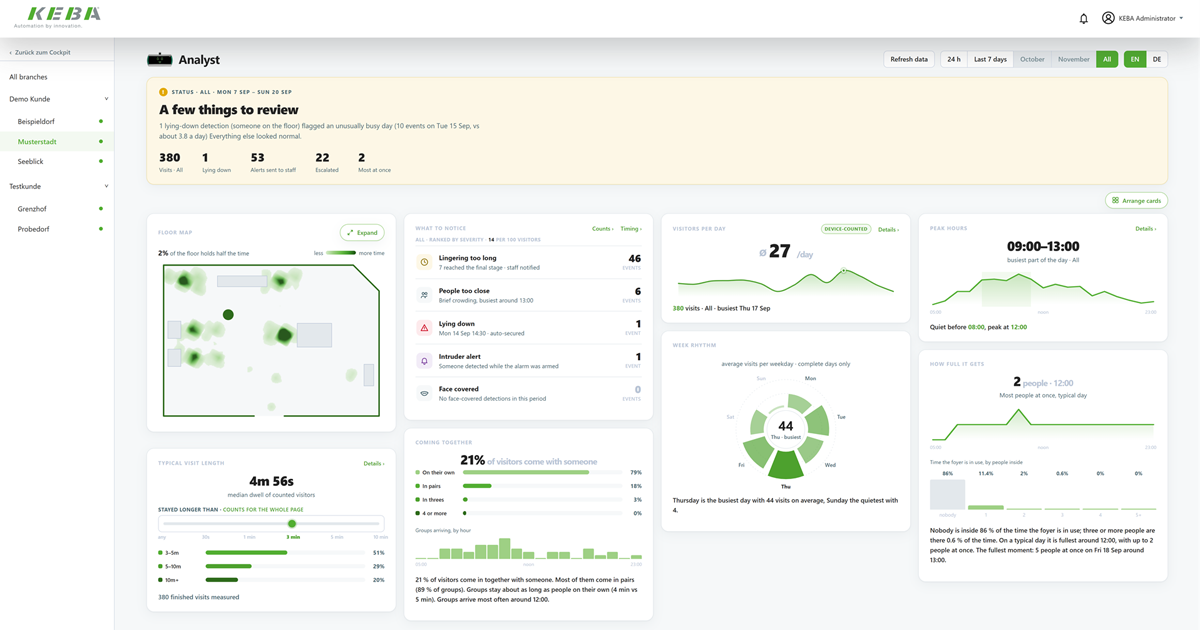
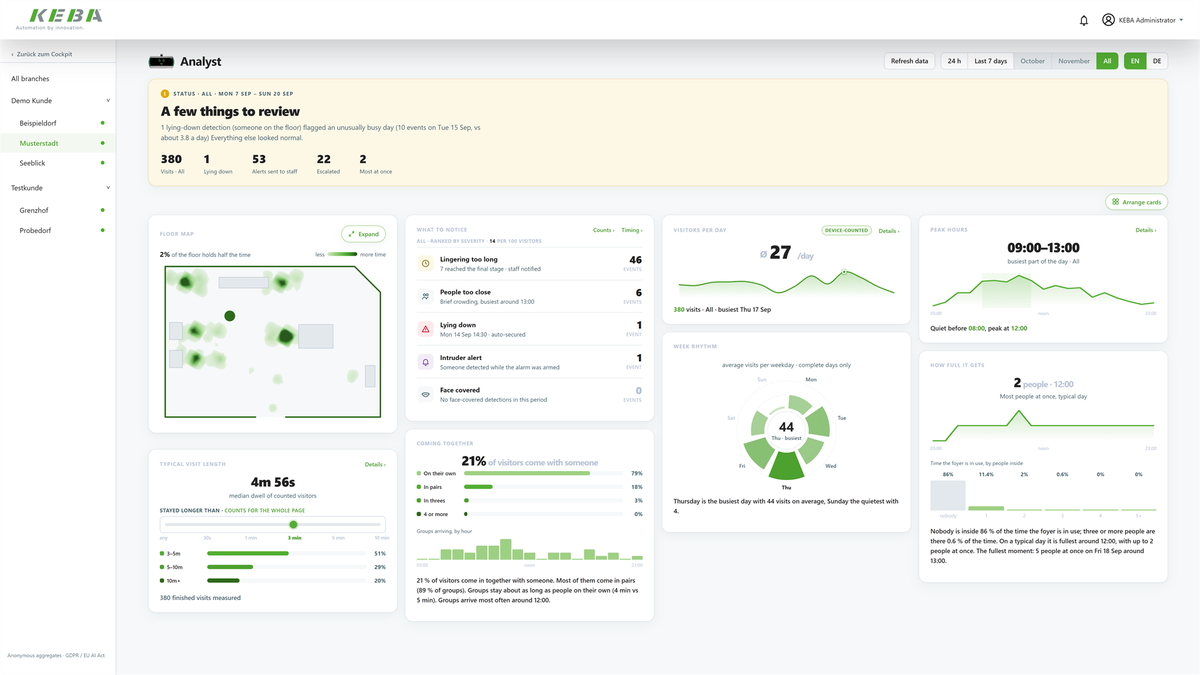
Analyst complements this device-level view with analytics on visitor traffic, occupancy, dwell time, space usage, and detected events. Integrated into the KeBob Cockpit, the functionality helps branch managers:
Identify usage patterns: How is a location used throughout the day and week?
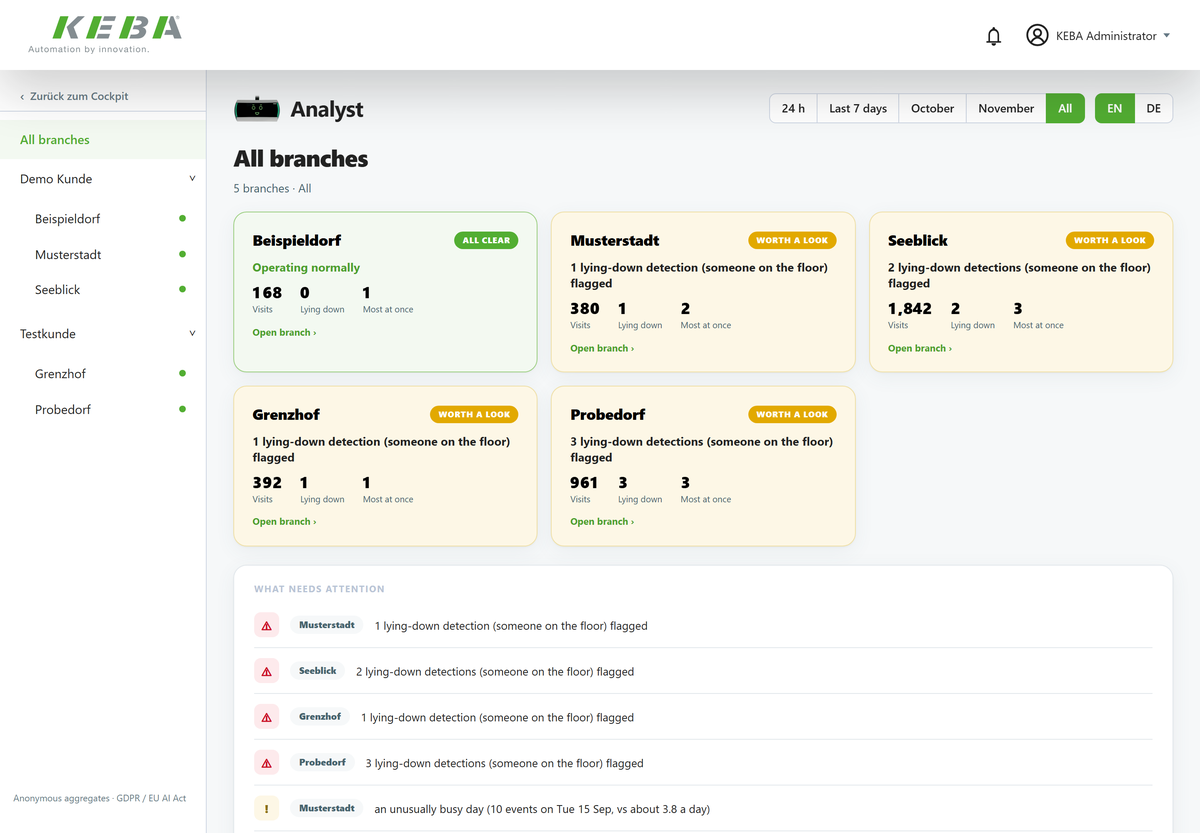
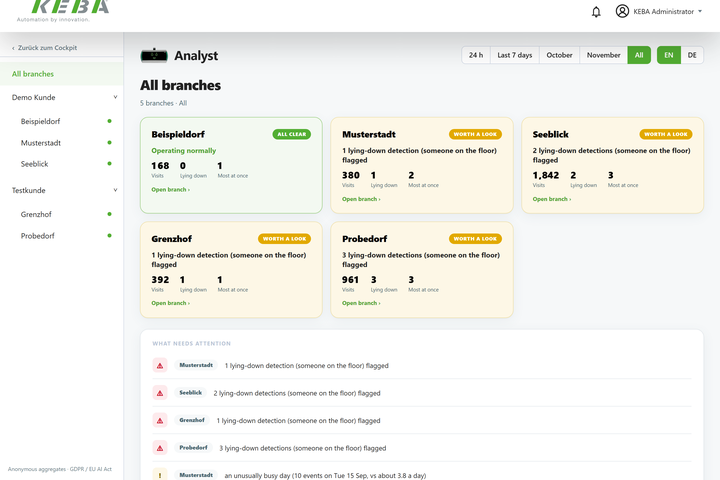
Keep track of multiple branches: A consolidated overview brings all connected locations together.
Investigate unusual patterns: Status overviews summarize key metrics and detected anomalies for the selected period.
Make better-informed decisions: The analytics highlight opportunities to improve the operation, organization, and layout of self-service areas.
Turning data into insights.
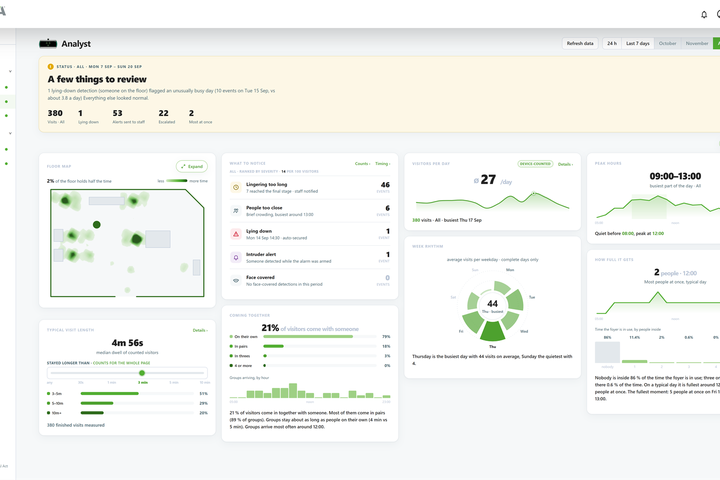
The new Analyst functionality in the KeBob Cockpit reveals how the bank foyer is used. These insights support decisions on branch layout, customer flow, resource allocation, and advertising spaces.
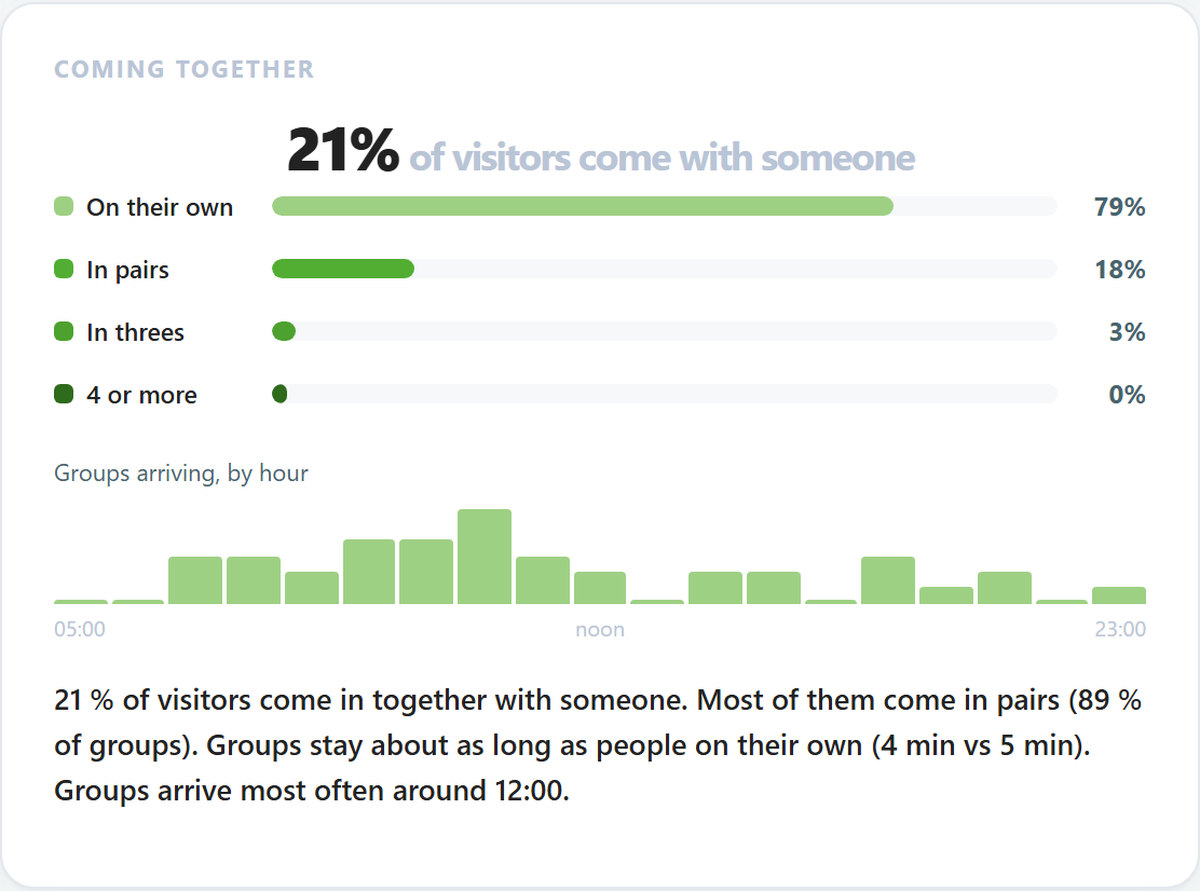
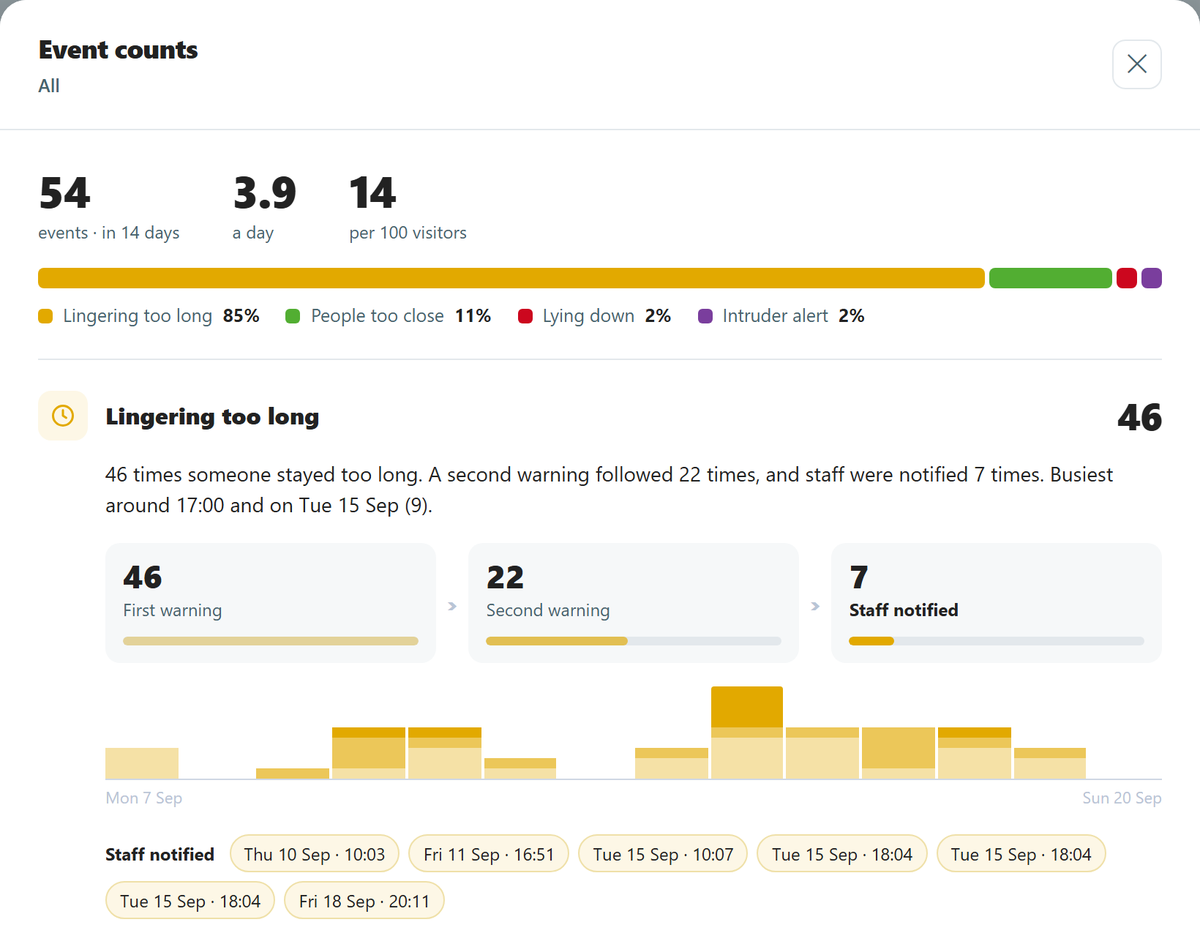
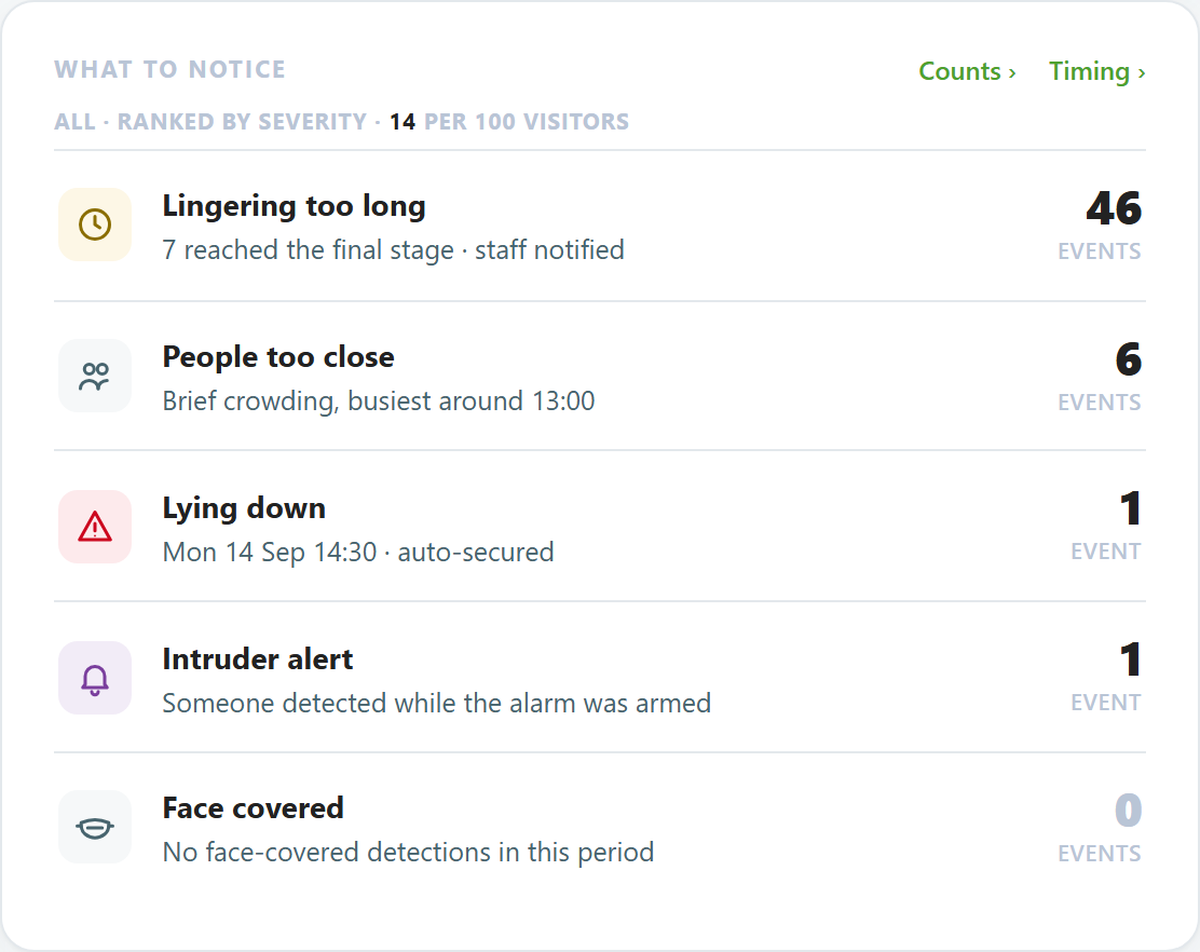
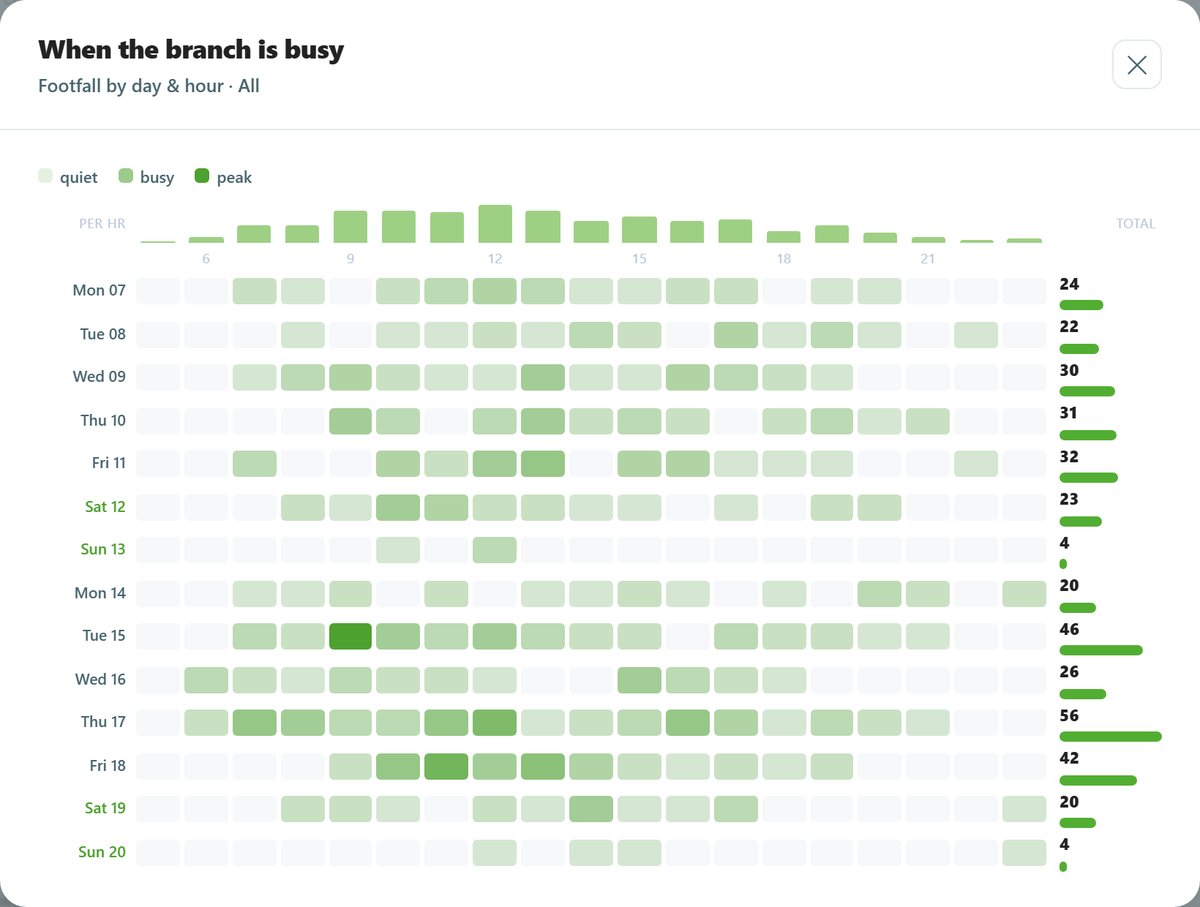
Understanding visitor traffic, occupancy, and dwell time
No single metric can fully capture how a self-service lobby is used. Many short visits can result in different patterns of space usage than fewer, longer stays. Analyst therefore brings together several perspectives:
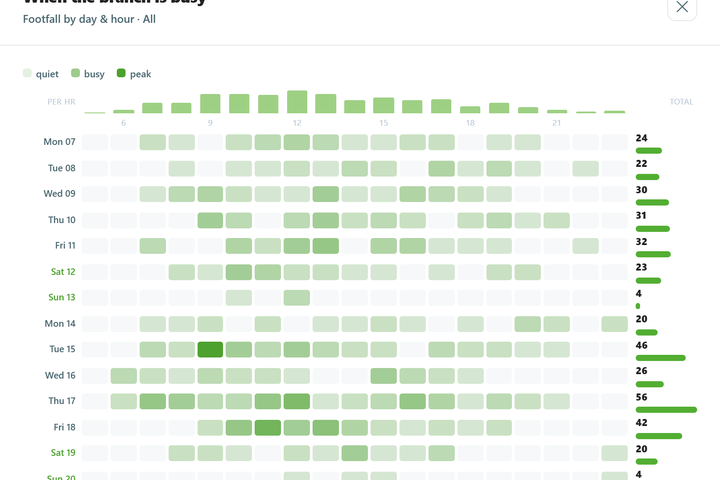
Visitor traffic: How many visitors arrive, and when? The number of recorded visits and their distribution across times of day and days of the week reveal peak hours and quieter periods. This can help schedule cleaning or maintenance during less busy times, for example. The metric counts visits: if a person returns several times, each visit may be counted separately.
Occupancy: How many people are in the lobby at the same time? The analysis shows when the space is empty, occupied by one person, or used by several people simultaneously. It also highlights peak occupancy levels. This provides insight into how intensively the available space is used at different times.
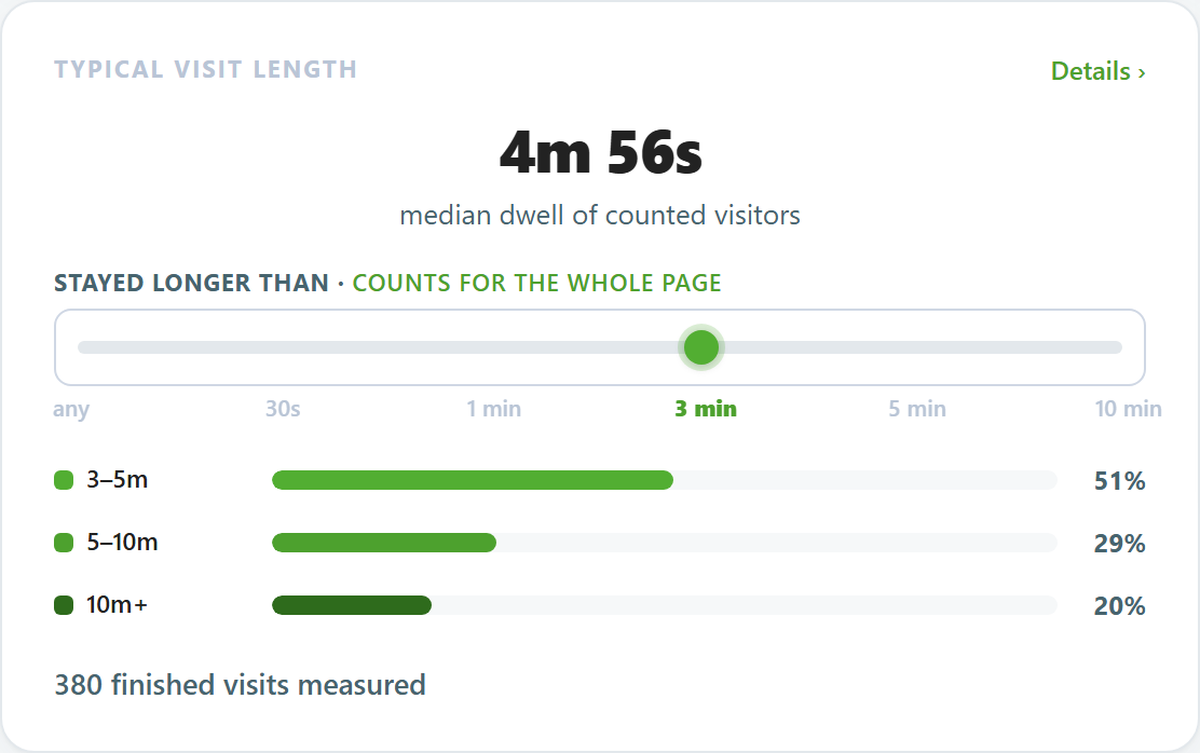
Dwell time: How long do people stay? Analyst shows the typical visit duration as a median, along with the distribution of visits across different time ranges. A configurable minimum dwell time allows very short stays to be excluded from visit-based analytics. Detected events remain visible regardless of this setting.
Together, these metrics help build a clearer understanding of how the self-service area is used: Does higher visitor traffic coincide with longer stays? Are there times of day when usage differs significantly from the overall pattern?
These observations can prompt a closer review of processes or the lobby layout. A longer dwell time alone does not explain its cause. Combined with visitor traffic and occupancy, however, it can indicate where further investigation may be useful.
With KeBob’s new Analyst functionality, branch managers gain detailed insights into how their self-service areas are actually used—providing a solid foundation for branch optimization.

Heatmaps for bank branches reveal how space is used
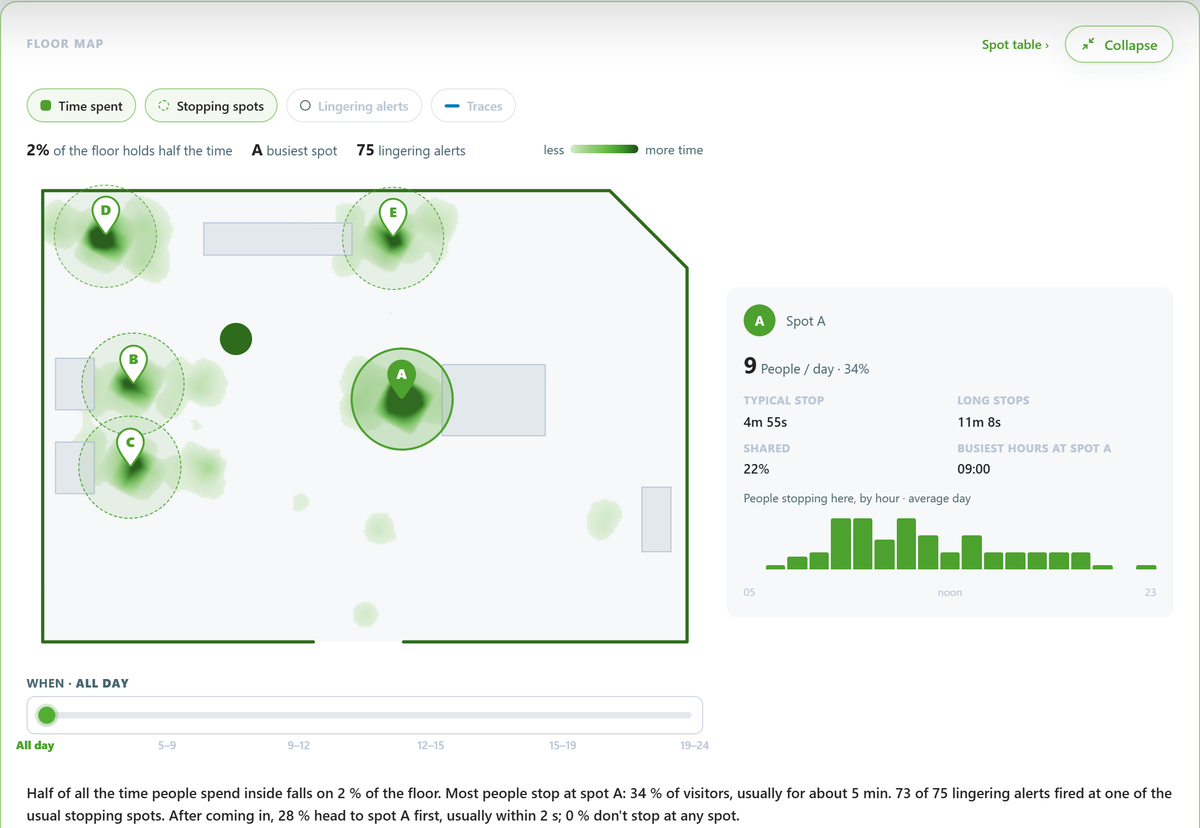
Where do people frequently spend time? Which areas are used less? Heatmaps visualize how the monitored bank lobby is used. They show where people tend to stay and how usage differs between daytime and nighttime, for example.
These heatmaps are made possible by KeBob’s Multi-Camera Tracking, which consistently tracks people across multiple camera views. Moving from one camera’s coverage area to another is therefore not automatically treated as a new person detection.
This unified view of the space provides the foundation for further analysis of usage and movement patterns.
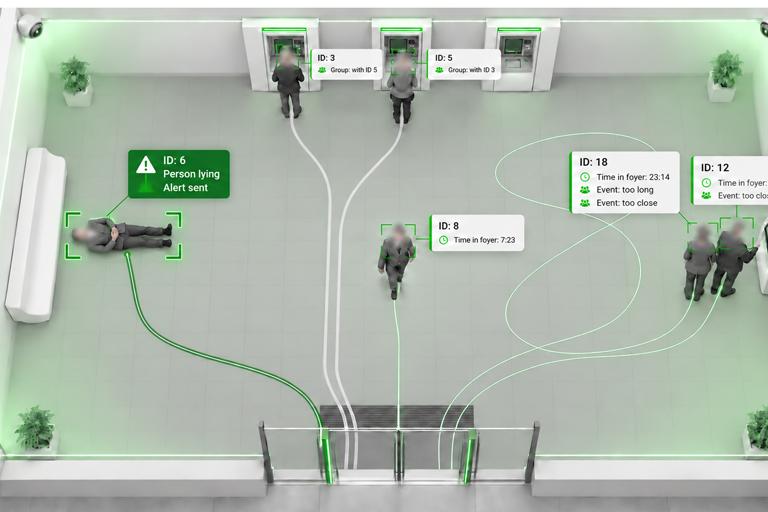
Further details are available for specific areas where people tend to spend time, including how often people stop there, how long they stay, and when the area is busiest. Typical movement paths can also be explored. These insights raise practical questions for branch optimization:
Does the layout of walkways reflect how the space is actually used?
Where do people tend to stay, and which areas are rarely used?
Are informational materials and advertising displays positioned in frequently used areas?
How does space usage vary by time of day?
The analytics help assess existing placements and plan targeted changes.
Analyzing security events and responses
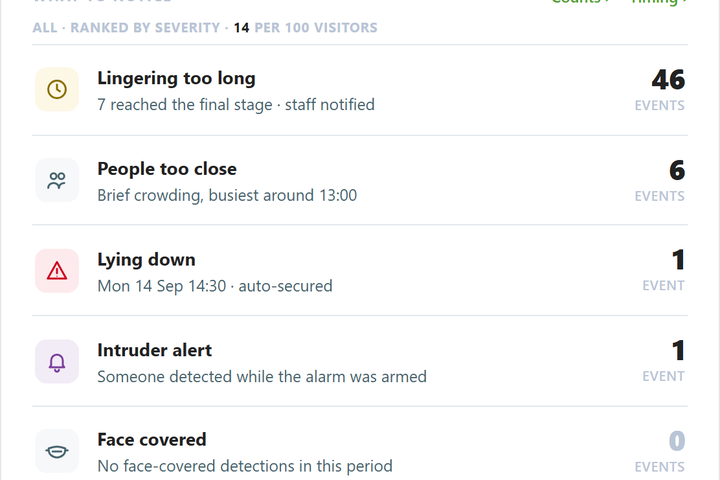
In addition to branch usage, Analyst evaluates detected events such as proximity alerts, people lying down, detected helmets, and unusually long stays. Depending on the event and configuration, it also shows which responses KeBob triggered—from an initial voice prompt to a notification sent to staff. The analysis reveals both how frequently situations were detected and how the associated responses progressed. While KeBob can respond immediately depending on the situation and configuration, Analyst supports analysis over a longer period. Recurring proximity alerts, for example, may prompt a review of the space available in the lobby. An alert initially describes a detected situation and does not automatically indicate a confirmed security incident.
From detection to branch analytics
KeBob already helps banks and savings banks make their self-service areas safer and more welcoming. Analyst extends these benefits with data-driven branch analytics. This also makes KeBob relevant for locations where improving the organization and cost efficiency of the lobby is a priority. This adds an important perspective to the benefits of AI-powered assistance in the lobby: A better understanding of how your self-service area is used reveals opportunities to improve its operation and layout.
Would you like to measure visitor traffic at your bank branch and learn more about how your self-service lobby is used? Talk to our experts about KeBob Analyst and the possibilities for your location.